Some Thoughts on Benchmarking (Part 1)
I recently received a quarterly summary of an expensive benchmarking survey on customer satisfaction--186 pages of absolute garbage that consisted largely of "this period vs. last period," bar graphs, pie charts, and peer group rankings colored blue (>50th percentile) or red (< 50th percentile). What are the hidden costs of high-level meetings (salaries and benefits) to interpret this monstrosity (drawing circles?) and the front-line cultural consequences?
In the robust context of my July 2006 column ("TQM, Six Sigma, Lean and...Data?"), benchmarking is the art of asking process-oriented questions so as to reduce the inappropriate and unintended variation in your organization's key processes. It's not, as I so often see, setting a high- percentile performance among your peers as an arbitrary target and declaring, "If they can do it, we can do it!" I've noticed that everyone wants to be at the 75th percentile or better (which would then make it the new 50th percentile, by the way).
There must be a rigorous review of your own operation down to the smallest detail vis-à-vis any benchmarked measure chosen. Ask the following questions:
• "What are we doing?"
•"How are we doing it?
•"What is our measure of how well we're doing it?"
•"Why are we looking for improvement?"
•"Have we made recent improvements?"
•"What are we planning to do next year?"
Then, rather than defend your status quo, you must ask the right questions to be able to compare your operation with that of the top performers--specifically, "Exactly what improvements did the high-performing peers make to achieve their performance?" Now, about that target…
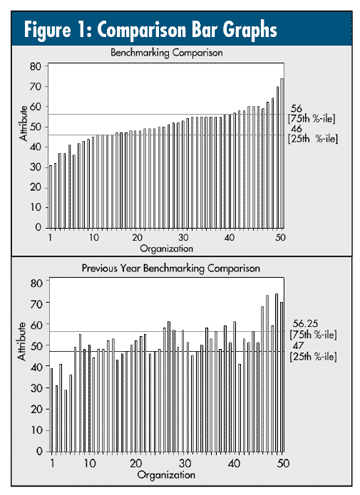
Suppose we have a baseline and post-baseline snapshot of some key characteristic--summarized in figure 1 (25th and 75th percentiles drawn in). The organizational ordering (i.e., x-axis) is identical on both graphs.

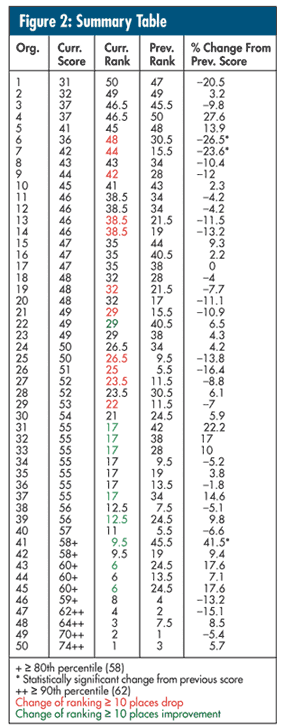
A typical comparison is summarized in the table in figure 2. The last column's "percent change from previous score" allows further (useless) comparison for a chosen performance standard rather than the alleged statistical significance: a difference in performance of, say, ± 10 percent or ± 15 percent, or perhaps plus or minus some arbitrary percentage ending in 0 or 5.

By the way, has anyone asked the question, "What constitutes a statistically significant difference from any declared benchmark?" Or, "What might constitute a criterion for declaring a benchmark?"
To be concluded in next month's column.
Davis Balestracci is a member of the American Society for Quality and past chair of its statistics division. He would love to wake up your conferences with his dynamic style and unique, entertaining insights into the places where process, statistics and quality meet. Visit his Web site at www.dbharmony.com.
|