Poisoned by Assumption
Karmond Geeya is a quality
technician for Coastal Cruisers Co., an organization that
produces outboard motors for marine vessels. He’s
responsible for final assembly of these motors, including
paint and trim, and for inspecting each product prior to
shipping. The inspection includes a variety of characteristics
representing quality components that CCC is interested in
producing. One inspection process addresses paint applications,
where defects are detected and recorded as data for analysis.
Geeya, who always reads the latest news in his field,
has discovered the helpfulness of c charts in statistical
process control and finds a pleasing synchronicity in using
this particular kind of chart for paint inspection. “After
all,” he notes wryly to his assistant, Hyde N. Sikh,
“it seems only fitting that CCC should use c charts.”
According to the textbook that Geeya has been consulting,
c charts should be used for discrete events. “Well,”
he muses, “a pit in the paint job is certainly a discrete
event.” Other requirements stipulate that the event
should be defined by one limited area (one motor, for example);
defects should be independent of each other; each type of
defect should occur infrequently; and the number of defects
in each sample should be independent. These factors are
characteristics of the Poisson distribution--something that
Geeya unfortunately calls the “poison” distribution.
As he instructs Sikh about the use of these charts, Geeya
reviews each of the assumptions, and the two of them decide
that, indeed, the analysis would be addressing discrete
occurrences, the defects would be confined to a well-defined
area--in this case, one motor--and that they’re independent
of each other. Sikh notes that the number of defects seems
to run up and then down. Geeya tells Sikh not to worry.
“I am a competent expert in SPC,” Geeya states
confidently.
 Is
Geeya correct in his view that the number of defects going
up and down doesn’t matter? Is
Geeya correct in his view that the number of defects going
up and down doesn’t matter?
By disregarding one of the essential assumptions, Karmond
Geeya is rendering the use of his c chart invalid. All of
the assumptions must be met. These assumptions are:
 The occurrences of a defect type are discrete.
 The area of opportunity (e.g., a motor) is well-defined.
 The occurrence of one type of defect isn’t influenced
by the occurrence of another type.
 The probability of any one type of defect’s occurrence
is small.
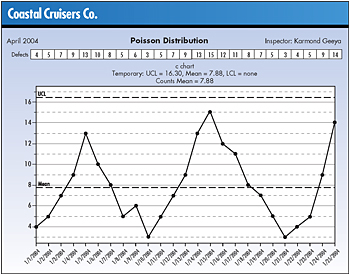
In looking at the graph of the data, it appears that the
samples are not independent of each other. As can be seen,
there’s clearly a pattern of going up and then down
over and over again. It’s interesting to note that
even though this pattern is obvious, no points are outside
the control limits and there are no runs.
It appears that Geeya has truly created a “poisonous”
control chart.
Michael J. Cleary, Ph.D., founder and president of
PQ Systems Inc., is a noted authority in the field of quality
management and a professor emeritus of management science
at Wright State University in Dayton, Ohio. A 29-year professorship
in management science has enabled Cleary to conduct extensive
research and garner valuable experience in expanding quality
management methods. He has published articles on quality
management and statistical process control in a variety
of academic and professional journals.
|