When Statistics Meet Reality
Statistics can be used to “massage” data and prove anything, right? Not!
Thanks to Six Sigma, statistics-as-panacea thinking is flourishing like the statistical process control craze of 20 years ago. Yet most university courses and industrial technique training lack a crucial context for quality improvement, an omission that invalidates much of what’s taught.
The key clarification lies in defining “enumerative” vs. “analytic” statistics. Traditional statistical education uses an enumerative framework, whereas quality improvement requires an analytic one. To contrast them:
 Enumerative: “What can I say about this specific group of widgets?” Enumerative: “What can I say about this specific group of widgets?”
 Analytic: “What can I say about the process that produced the result in this group of widgets?” Analytic: “What can I say about the process that produced the result in this group of widgets?”
An enumerative study always focuses on the actual state of something at one specific point in the past--no more, no less. Thus, one can statistically summarize today’s batch of widgets. How does this help predict future production?
An analytic study samples a process and predicts the results of future action in circumstances one can’t fully know. It’s this predictive thinking that’s fundamental to quality improvement.
Both kinds of statistics count or measure samples. Enumerative methods state statistical problems in terms of repeated sampling from the same population under circumstances where nothing changes over time--a simple mathematical theory but unrelated to the real needs of the everyday statistical user.
 Results of experiments are subsequently implemented in environments where there’s no formal control over how people interpret the result. Therefore, unintended and inappropriate variation will creep into the process. Only analytic methods expose this variation and deal with it appropriately, thereby making the process more predictable. In other words, in a quality professional’s real-ity, no formal, static population exists. Results of experiments are subsequently implemented in environments where there’s no formal control over how people interpret the result. Therefore, unintended and inappropriate variation will creep into the process. Only analytic methods expose this variation and deal with it appropriately, thereby making the process more predictable. In other words, in a quality professional’s real-ity, no formal, static population exists.
So how does one randomly sample the future? Certainly not by relying on what happens from the results of a single sample. Repeated sampling under as many different circumstances as possible is necessary to establish increasing belief in the result. The process isn’t as simple as accepting or rejecting hypotheses and assuming the result will apply anywhere, any time.
To succinctly summarize the analytic approach, one must “plot the dots… plot the dots… plot the dots!”
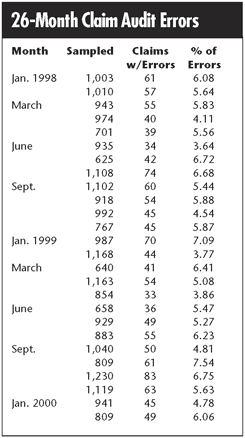
Consider the following scenario. I was consulting for an insurance company where an important quality requirement was the percent of claims processed correctly. An audit department took a monthly random sample of processed claims and reported its result as an overall indicator of quality--a classic use of sampling plans. Moreover, the results of the current month’s sample were used to adjust the sample size for the next month’s audit--rewarding “good” results and punishing “bad” ones.
Twenty-six months of the department’s audit data are shown in the table to the right.
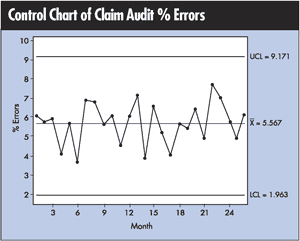
I plotted a simple control chart of the percent of errors and obtained the chart above. Purists, I know, will think I should have done a p-chart. That’s a whole other article, but rest assured the p-chart is stable as well.
The process hadn’t changed in more than two years, and yet the sampling statistics were technically correct. They estimated the current month’s result--no more, no less.
 I’m sure a documented standard procedure existed somewhere that required this formal and expensive audit, but for what purpose? It did nothing but waste energy and money to answer the question, “What’s this month’s statistical variation from 5.6 percent?” This energy could have gone toward improving the process, which would require different--and simpler--analytic statistical methods. I’m sure a documented standard procedure existed somewhere that required this formal and expensive audit, but for what purpose? It did nothing but waste energy and money to answer the question, “What’s this month’s statistical variation from 5.6 percent?” This energy could have gone toward improving the process, which would require different--and simpler--analytic statistical methods.
I asked what was done with the claims after the audit and was told, “Nothing.” I asked whether the auditors might consider taking the next three months’ worth of claims with errors and perform some type of error analysis. Blank stares were the response. That wasn’t the department’s job. However, the auditors were quite adept at taking that month’s result and calculating next month’s sample size. As W. Edwards Deming would say, “Simple… obvious… and wrong!”
Now, what about the managers who received the audit results? I’m sure they used these results for improvement purposes and to track trends--an incorrect objective, given the way these data were collected.
Did you know that given two numbers, one will be bigger? The key question is, “Is the process that produced the second number the same as the process that produced the first number?” No one had ever charted the results to assess the process, nor could I convince them that it was a useful thing to do.
As quality professionals, it’s important to realize that data analysis goes far beyond routine, statistical number crunching. Our greatest contribution to an organization is getting people not only to understand and use a process-oriented context when analyzing situations but also principles of simple, efficient data collection, analysis and display. This can’t help but enhance quality professionals’ credibility as well as gain the confidence and cooperation of the entire organization during stressful transitions and investigations.
It’s vital that we stop many of the current well-meaning but ultimately damaging ad hoc uses of statistics because, whether people understand statistics or not, they’re already using them--and with the best intentions.
Davis Balestracci is the author of Quality Improvement: Practical Applications for Medical Group Practice (Center for Research in Ambulatory Health Care Administration, 1994), currently in its second edition.
Davis is a member of the American Society for Quality, the Association for Quality and Participation, and is the past president of the Twin Cities Deming Forum. He is past chair of the statistics division of ASQ.
|