Running Circles Around Control Charts
I‘m so sick of patronizing articles touting how wonderful control charts are -- when in reality they bog down heavily in the mechanics. Then there are the torturous discussions of “special cause tests,” generally within a context of using them as special cause--i.e., each one must be individually investigated--as opposed to common cause--i.e., might there be one underlying explanation generating all of these signals?
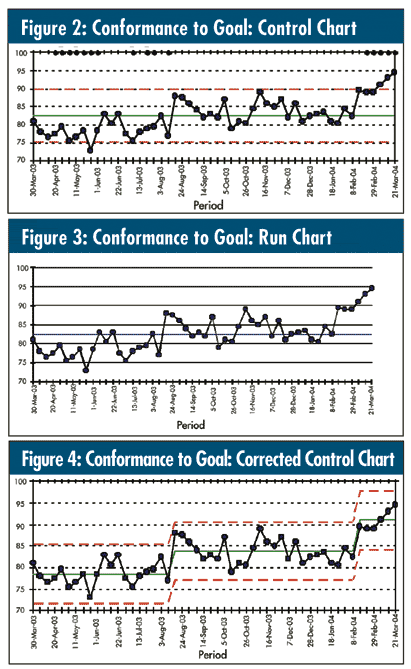
Someone once presented me with the graph seen in figure 1. (Yes, the y-scale started at zero.) It almost convinces you that there’s a trend, doesn’t it? I can picture a Black Belt scolding the team, “Now, now, now… test the date for normality and if it passes (note: it does--p-value = 0.507), you need to plot that as a control chart!” (See figure 2.)


Sixteen of the 52 data points generate signals; 30 special causes in total. Where do you start? Obviously, with the four points outside the three standard deviation limits (observations Nos. 9 and 50-52)… Not!
Through the years I’ve developed an increasing affection for the much-neglected run chart--a time plot of your process data with the median drawn in as a reference (as seen in my January 2005 column, “Asking the Right Questions”). It’s “Filter No. 1” for any process data and answers the question, “Did this process have at least one shift during this time period?” This generally is signaled by a clump of eight consecutive points either all above or below the median. If the process did have such a shift, then it makes no sense to do a control chart at this time because the average of all these data doesn’t exist. (Sort of like, “If I put my right foot in a bucket of boiling water and my left foot in a bucket of ice water, on the average, I’m pretty comfortable.”) One of the healthiest things that a run chart can do for you is to get you thinking “process needle”--i.e., focusing on the process’s central tendency.
Most of the time, run charts are taught as the boring prerequisite to learning control charts. It’s far more exciting to jump right to a control chart of all the data, look at the
special-cause signals, and, as previously mentioned, try to find reasons for each individual signal, right?
A run chart doesn’t find individual special-cause observations because that’s not its purpose. That’s the objective of a control chart as “Filter No. 2”--i.e., plotting data after the shifts have been determined, which then usually reduces the number of special-cause signals, resulting in a lot less confusion.
So, what light might a run chart shed on this situation? See figure 3.
With the y-axis scale much healthier and not having control limits as distractions, doesn’t it look like the “needle” shifted twice--around Aug. 17th, with observation No. 21, and Feb. 17th, with observation No. 47? In fact, when I asked the clients about those two dates, they looked at me like I was a magician and asked, “How did you know?” Those dates coincided with two major interventions to improve this process. As the chart shows, they worked--as two “needle bumps,” not a continuously increasing improvement “trend.” So, the correct resulting control chart is seen in figure 4, and there’s not a special cause to be found.
Once again, I’m reminded of Deming’s curmudgeonly hatred of what he termed statistical “hacks.”
Davis Balestracci is a member of the American Society for Quality and past chair of its statistics division. He would love to wake up your conferences with his dynamic style and unique, entertaining insights into the places where process, statistics, and quality meet. Visit his Web site at www.dbharmony.com .
|