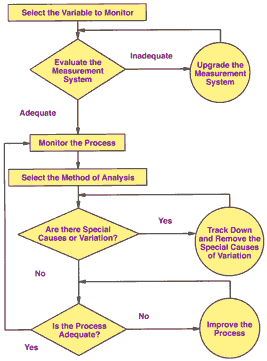
The basic idea of statistical process control is fairly easy to explain. Let's start with a picture such as
Figure 1. This flow chart represents the basis for all quality control systems. You start by selecting a  variable to monitor. It should be one of the important characteristics of your process. Once you've selected this variable, you have to evaluate your
measurement system. Remember that all measurement systems have some error. It's important to quantify this error and compare it to the specification you're trying to
hold. For example, if you were trying to measure the diameter of a steel shaft with a pair of calipers, you could expect an error of several ten thousandths of an inch in repeat
measurements (i.e., if you repeat the measurement of the same part in the same place in the same way, you will get a slightly different result each time). variable to monitor. It should be one of the important characteristics of your process. Once you've selected this variable, you have to evaluate your
measurement system. Remember that all measurement systems have some error. It's important to quantify this error and compare it to the specification you're trying to
hold. For example, if you were trying to measure the diameter of a steel shaft with a pair of calipers, you could expect an error of several ten thousandths of an inch in repeat
measurements (i.e., if you repeat the measurement of the same part in the same place in the same way, you will get a slightly different result each time).
Let's say you measure the part twice, and the two readings differ by 0.003 in. And let's say the specification
you're trying to hold is ± 0.005 in. In this case, 30 percent (0.003/0.010 in.) of your specification is being consumed by measurement error. Clearly, that's
unacceptable. However, I haven't been able to find any guidelines on how much measurement error is considered acceptable. (If any of you know of an authority
that provides such guidelines, please send me an e-mail.) It may have to be resolved on a case-by-case basis.
After you have a good feel for the error present in your measurements, you can begin to monitor the process. This is simply a process of measuring the variable you
have selected and keeping records. Next you select a method of analysis. Often it's a control chart. Sometimes it might be just a line graph or a histogram. In many
cases, you'll use all of these and other tools. Remember, the goal is to study the process and learn what makes it change.
How do you know if your process is changing? In some cases it's easy. If the machine is old and hasn't been maintained very well, the process is probably
changing all the time. If your variation is excessive, it will be necessary to go through the process and fix all obvious problems. This may seem obvious, but I've often
been assigned to study a process where many of the people in the area knew things weren't right but believed that they couldn't do anything about it. In fact, at the
beginning of a process study, it's not uncommon for almost all the points on the control chart to be out of control. In a way, that's good news, as it should be very
easy to make improvements in such a process. When all the points are in control, you must redesign the process to make it more capable. In either case, you're
tracking down and removing causes of variation. Control charts are very sensitive tools for finding small changes in your process.
Once all of the obvious problems have been fixed, the control chart helps you detect minor changes. Don't assume, as many people do, that the process can't
continue to run if the chart has points outside the control limits. I've even heard supervisors discipline employees because their charts are "out of control." An
out-of-control chart is not like an out-of-control car; points outside the limits just mean that the process is changing. It may not be possible to instantly determine why it's changing. Tracking down and removing special causes of variation is easier said than done. In fact, it might take months, even years, before the process is absolutely stable.
The good news is that removing just some of the causes of variation will make such noticeable improvements that everyone will be thrilled.
Once the process is operating or close to operating in a state of statistical control, use a process capability study to determine whether the process is capable.
Specific instructions for conducting such a study can be found in any good book on SPC. If the process isn't capable of providing a good Cpk, it will be necessary to
redesign it. Even if the process has a good capability ratio, your job isn't done. It's essential to continue to monitor the process for as long as it is in operation. One
strange belief I've run across is that a process study should be brought to closure. I've never understood this. Processes change in many little ways all the time and
may start to change in larger ways at any moment. It's therefore necessary to continue to monitor them for as long as they're in operation. The way people get
into trouble is by not monitoring their processes. Unfortunately, it's pretty boring to monitor a stable process, but you might say that boredom is essential to a well-run process.
About the author Gregory P. Ferguson is senior quality engineer at Global Solar Energy in
Tucson, Arizona. He has published technical articles and assisted in the publication of two books. Comments can be e-mailed to him at gferguson@qualitydigest.com . |