by Dirk Dusharme
We all have our favorite places to shop. I shop for groceries at Bel Air or Trader Joe's, I buy clothes at The Gap Inc. or J.C. Penney Co. Inc. and do my book shopping at Barnes & Noble or Borders. There are also stores that I try to avoid unless absolutely necessary. You are, no doubt, the same. We all tend to gravitate to those stores that give us value, service and a pleasant shopping experience. Ask people what they value in a retailer, and it typically boils down to just these three factors:
• Value. We want to feel that we've gotten our money's worth. This is subjective and not literal. It isn't always necessary that we have truly gotten a better buy, but only that it feels that way. For instance, there are discount stores that have better prices on grocery items than my local grocer. But if I enjoy the shopping experience at my local store, the value for me is higher than at a discounter, even though the cost may be a bit more.
• Service. Put simply, we all feel that if we're handing over our hard-earned cash to someone, the least they can do is smile. We also expect problems such as returns or damaged merchandise to be dealt with quickly and professionally.
• Shopping experience. To some extent, we want to enjoy the experience. This includes factors such as cleanliness, lighting, availability of restrooms (perhaps with changing tables if you're a parent), merchandise that's clearly marked and easy to find, and so forth.
Over the past several years, readers have asked us to do some sort of retailer customer satisfaction survey that would look at the basic factors that determine overall shopping experience and examine how various large chains stack up.
What follows are the results of a survey administered late last month.
Before the survey, we first asked people what was important to them when choosing a retailer. The key factors turned out to be cost, employee helpfulness, quality of the merchandise sold, return policies, cleanliness and ease of finding merchandise. We converted those responses into survey items, which you can view along the top of the table in figure 2 below. You can also download a pdf of the entire article where the tables will be more legible.
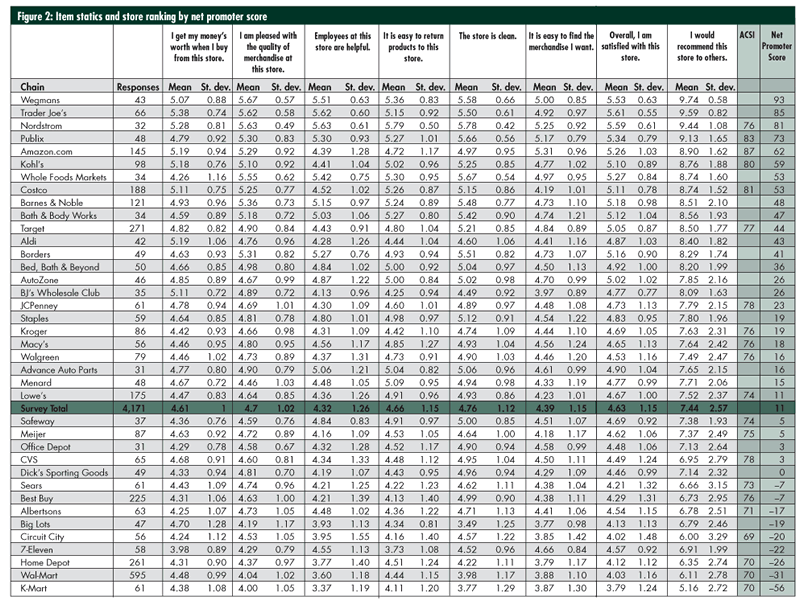
Each item was given a six-point response scale: Completely disagree, strongly disagree, disagree, agree, strongly agree and completely agree. The respondent was also given the choice of "I don't know."
We followed these key factors with two "overall" items:
• Overall, I am satisfied with this store.
• I would recommend this store to others.
The first item was given the same six-point response scale as the above impressions. The next was given a 0- to 10-point response scale.
OK. We know you're dying to do it, so before we take a close look at the data, go ahead and look at figure 1 below and locate your favorite stores. We'll wait.
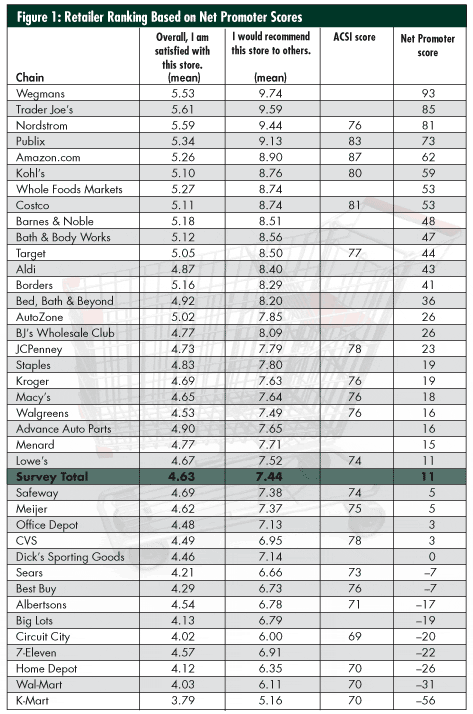
That table contains four columns, each representing a different method of scoring that retailer's customer satisfaction. The first column is the mean of the six-point rating (six is best) for the question "Overall, I am satisfied with this store." The second column is the mean of the 11-point rating for "I would recommend this store to others."
The third column is the score this retailer received from the American Customer Satisfaction Index (if available). The ACSI is an economic indicator based on customer evaluations of the quality of goods and services purchased in the United States. The 12-year-old index was developed by the National Quality Research Center at the Stephen M. Ross Business School at the University of Michigan. For the ACSI, survey respondents are randomly selected via automatic phone dialers, and data collected via one-on-one interviews. For a company to be included in the ACSI, it must have 250 responses. Because the ACSI measures in a scientific way what we are attempting to measure here, we've included the ACSI results when possible as a means to provide some sort of validation for our own results.
The last column in figure 1 is the Net Promoter score for that retailer. The Net Promoter score was co-developed by Fred Reichheld, a well-known loyalty expert, and Laura Brooks, Ph.D., of Satmetrix. The Net Promoter score is based on one "ultimate" question: "How likely are you to recommend this store to friends or colleagues?" In our case, we used the "I would recommend this store to others" item. The question is scored on a 10-point scale, with zero representing least likely. The Net Promoter score is the percentage of respondents giving a score of 9 or 10 (promoters), minus the percentage of those giving a score of 0 to 6 (detractors). The Net Promoter score is purported to be an accurate measurement of customer loyalty. Because the Net Promoter score is the hot new thing in customer loyalty measures, we have opted to use it here.
Though its methodology and questions are quite different from Quality Digest's , there was a reasonable degree of correlation between ACSI's results and ours. With a few exceptions, higher ACSI scores correspond to high Net Promoter scores. The same is true for midrange and low scores.
Following the advice of popular Quality Digest contributor Craig Cochran, we included a "comments" section in our survey so that we could glean a little more information about why respondents answered in the way that they did. In this section, we focus on comments about retailers that have often appeared in Quality Digest editorials and letters from readers.
Most interesting is the comparison of comments about Wal-Mart and Target. The two retailers are usually spoken of in the same breath, and those who shop at big box stores typically shop at either one or the other.
Of the comments about Wal-Mart, 27 percent complained of poor customer service, unknowledgeable or inattentive staff, or rudeness. About 15 percent complained about product quality and the large number of products made overseas, and 12 percent commented on crowded aisles and checkout lines. About 5 percent said that they preferred to shop at Target. Wal-Mart was second from the bottom of our survey.
Although a few respondents had positive remarks regarding Wal-Mart's service and cleanliness, the majority of positive comments had to do with cost and convenience.
On the other hand, 34 percent of comments praised Target for its wide aisles, nice layout and good lighting. Service complaints (staff helpfulness, return policy, etc.) matched service praise at around 11 percent each. Nearly 15 percent of respondents specifically pointed out that they shopped at Target instead of Wal-Mart. The reasons for that were varied but mostly concerned store layout and staff helpfulness.
We were curious as to what a sampling of comments would show us about the top-performing retailers--Wegmans and Trader Joe's, both of which are grocery stores. Both of these stores also top Consumer Reports' list of grocery chains. Our survey and Consumer Reports also agree with the rankings of the other top-rated grocers--Publix, Whole Foods Market, Costco and Aldi. ( Consumer Reports includes some grocers not included in our list.)
Wegmans is a small supermarket chain with stores in New York, Pennsylvania, New Jersey, Virginia and Maryland. Wegmans has appeared in FORTUNE magazine's list of the "100 Best Companies to Work For" for 10 consecutive years, this year ending up at No. 3.
More than a third (36%) of the positive comments focused on Wegmans' customer service, with the rest dispersed among store cleanliness, product quality and well-stocked shelves. The only negative comments (10%) were from respondents who felt that Wegmans was a little more expensive than other stores.
Trader Joe's is a grocery chain that carries exotic and organic products as well as standard grocery items. Although Trader Joe's has fewer than 300 stores in 20 states, it has a loyal and exuberant following, which the survey scores and comments reflect. The majority of the positive comments were fairly evenly dispersed among four categories, with product selection (22%) and price (19%) barely nudging out quality and service (17% each). Many respondents (13%) made positive comments on the shopping experience. The only negative comments (6%) were related to Trader Joe's tight, sometimes cramped, aisles.
The positive comments for Wegmans and Trader Joe's spanned the entire range of the customer experience: price, ambiance, service, selection and so forth. It seems that the cream of the crop focus their attention on the entire customer experience and not just one factor, such as price.
Maybe you don't care about which store placed where. You might, however, be interested in knowing why they placed where they did. What factors have the most influence on customer loyalty? How might this apply to your business? To analyze this, we turned our data over to Tom Pyzdek, an expert in customer survey analysis.
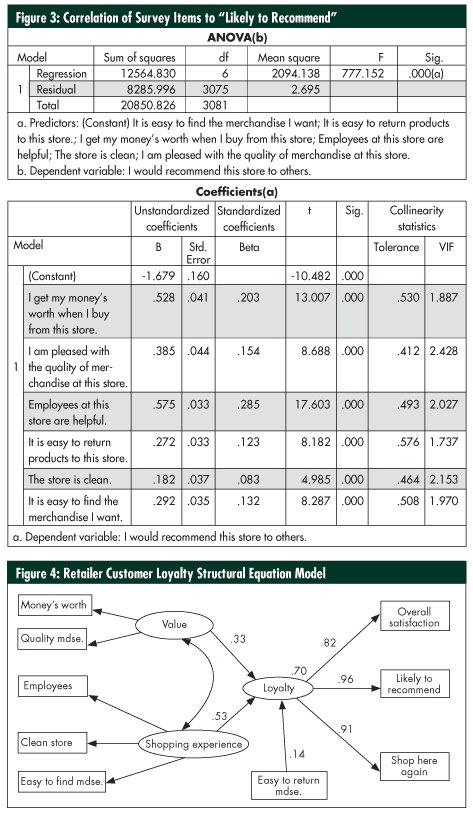
His first pass was a simple regression analysis that looked at the correlation between "Likely to recommend" and each of the six "experience" factors. Looking at the "B" column in the bottom half of figure 3, you can see the correlation values for each of the six factors (bigger is better). Although intuitively you might expect value ("I get my money's worth") to be the most highly correlated with customer loyalty, it isn't. That distinction falls to employee helpfulness, with value close behind. Quality was the third most-correlated factor to loyalty.
This may not be too surprising. Much has been said about product quality being "good enough" and that most people now look at other factors when purchasing products and services. Although some might complain about "cheap Chinese imports" and so forth, what we really seem to care about is how much hassle we're going to get when we try to return those items. As long as service is prompt and friendly, we will deal with higher price or poorer quality. In fact, some survey respondents made exactly that comment. The majority of comments for retailers on both ends of the scale largely focused on service, good or bad.
As we mentioned at the beginning of this article, value may encompass several factors. To look at this, Pyzdek created a structural equation model (SEM) that provides a clear picture of the interaction of all factors and their contribution to customer loyalty. Figure 4 shows a simplified SEM. Two items of note immediately pop out. First, "money's worth" does not stand on its own. It is closely correlated with "quality of merchandise," so that the two items together can be collectively considered a factor that we call "value." The implication is that money's worth is not simply cost but, rather, whether cost is commensurate with quality.
Second, we see a strong correlation between "employee helpfulness," "store cleanliness" and "ease of finding merchandise." We can consider these three items as one factor that we will call "shopping experience."
The "easy-to-return" item is not strongly correlated with any of the other items; it also doesn't contribute much to loyalty, although its effect is statistically significant. We also need to keep in mind that this is a single survey item, while the other factors summarize more than one survey item.
The model clearly illustrates that shopping experience has the biggest effect on loyalty. When this factor changes by 1 standard deviation, loyalty changes by 0.53 standard deviations. When the value factor changes by 1 standard deviation, loyalty changes by 0.33 standard deviations. And when the "easy to return items" score changes by 1 standard deviation, loyalty changes by 0.14 standard deviations. When all of these causes are combined they explain 70 percent of the variance in loyalty.
Simply put, our survey seems to indicate that customers value the shopping experience above all else with a key contributor to that being employee helpfulness.
Sure, a decent price and decent quality are important. They're also expected. At this point you and your competitors probably already provide good value, and your customers already assume they're paying what your product is worth. If you're going to keep customers, the key factor seems to be helpfulness (or service). Another indicator of this is Consumer Reports' look at grocery chains. If price were a determining factor in customer satisfaction, then stores like Wal-Mart, which got the magazine's highest mark for price, should be closer to the top of the list.
The survey instrument was created using Survey Gold from Golden Hills Software Inc. The survey was hosted on Survey Gold's Web site and responses later downloaded for analysis. An invitation to take part in the survey was sent via e-mail to our complete list of print and online newsletter subscribers (those whose e-mail addresses we had). Of those, roughly 4,200 responded. Each was given a user identification number and directed to the Web site where the survey form was located. Respondents chose from a list of 100 of the nation's top retailers and responded to questions about their shopping experience at that retailer. Respondents could fill out a survey on more than one store but could not respond more than once for any particular store.
Respondents who were not recognized by their identifier were eliminated from the survey. If a respondent filled out more than one form for a particular retailer, all forms except the first one were eliminated. Therefore, the responses included only those respondents whom we recognized from the unique identifier and only one form per respondent per retailer was left in. This left us with 4,171 responses.
Only stores with more than 30 responses (38 stores) were included in the final results.
Basic data analysis was done at Quality Digest, with further analysis performed by Tom Pyzdek. A member of the American Customer Satisfaction Index provided insight on how the ACSI is administered.
We need to acknowledge that, unlike the ACSI survey, this wasn't a scientific survey in the strictest sense and possibly suffers from a couple of bias problems. First, respondents were not directly contacted by a human, only sent an invitation, so there may be some self-selection bias at work. However, we have tested similarly delivered surveys for self-selection bias in the past and found it to be negligible. A greater problem may be that the invitation was not sent to the general population, but to our print and online readership, the majority of which are quality professionals. Meaning, it could be argued that our results only represent the opinions of quality professionals, and we all know what a picky lot they are.
Dirk Dusharme is Quality Digest's editor in chief.
|