| by Diana Levey
Checked your tires lately? Leighton Spadone has. Spadone is a research and development associate for the Goodyear Tire and Rubber Co., and he's been taking a hard look at commercial truck tires. He's a member of an American Society of Testing and Materials task group charged with developing laboratory high-speed and endurance tests for these tires.
A primary objective in developing the tests is to measure tire operating temperatures and compare those temperatures with those of tires tested in a laboratory. The Department of Transportation and the National Highway Traffic Safety Administration regulate all transportation products. Tire manufacturers must demonstrate that their products pass standardized regulatory tests, at which point they may display the "DOT" symbol on their tire sidewalls, required for highway use in the United States.
Congress recently tasked the NHTSA to review and, if necessary, update tire tests for all vehicles. After studying and upgrading passenger and light-truck tests, the agency requested ASTM assistance for the commercial-truck tire phase.
"There's a vast difference between tires running on a flat highway as compared with those running against a curved laboratory road-wheel," says Terry Ruip, technology adviser for Goodyear's tire test engineering department and chairman of the ASTM truck/bus tire test development task group. "Because of the effect of the curvature of that road-wheel upon a truck tire, the tire's temperatures are much hotter in the lab than on the road. We needed to document what those differences are so that when we develop new lab-test standards, we will have done so using realistic operating temperatures."
To do that, the task group established designs of experiments (DOEs) using typical truck-tire operating conditions. Typical of problems faced by engineers, what may be clear to them isn't necessarily clear to nontechnical people, so the results of the DOEs needed to not only make sense to nonstatisticians and to easily produce models and "what-if" scenarios. Critical to creating DOEs and presenting the data in a meaningful way to nonstatisticians is the use of statistical software.

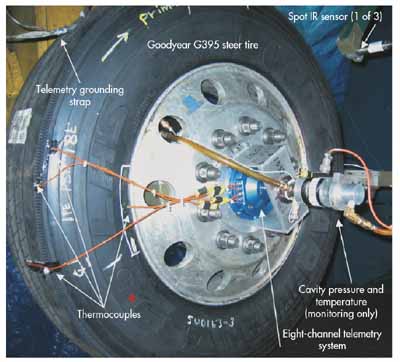
Test setup for monitoriing tire temperature at key points
|
The basic objective was to build a regression model for these data that would explain the effect of tire operating conditions on internal tire temperatures. "In this particular case, we were most interested in the temperatures on the edges of the belt at the shoulder of the tire, and at the center-line of the tire," says Spadone.
"We wanted to build a regression model that, based on our test conditions, predicts the temperature in the tire. We were successful in doing that," he continues. "We're now able to accurately predict belt-edge and center-line temperatures in commercial, over-the-road truck tires."
Spadone points out that one of the innovations in this modeling is to realize that inflation pressure in pounds per square inch (psi) and load in pounds are not the correct predictors of tire temperature--and that the models needed to be transformed using some complex nonlinear formulas. The team was able to easily build these formulas using their statistical software package to get the best model fit and to identify the correct predictors.
"The No. 1 innovation was to move out of the psi and load space and calculate a design space that better models the temperatures," adds Spadone.
With the regression models set and cleaned up and the outliers identified, the next step was to use the prediction equations to build templates, and then explore different conditions on the road-wheel and compare them with conditions on the highway.
The template feature in JMP statistical software, which Spadone and his team used throughout the DOE, is simply a data table containing the prediction equations and the predictor variables used in the equations. This allows systematic or "what-if" changes to the predictor variables.
In this case, the team could modify the conditions of load, speed, inflation, and tire dimensions separately for each flat or curved deflection. The software would then graph the changes in the tire running temperature at belt-edge and center-line tire locations at each deflection.
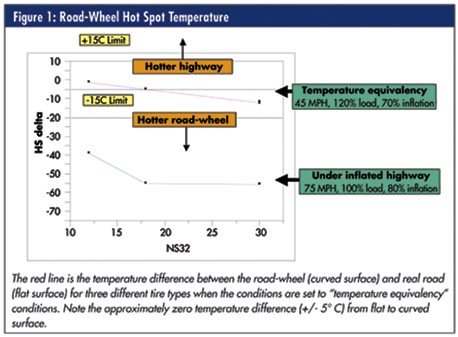
For example, the template allowed them to discover flat and curved conditions that resulted in equal temperatures at the belt-edge and center-line simultaneously for the highway and the road-wheel.
"We were looking for equivalent temperatures 'flat-to-curved,'" says Spadone. "We wanted to demonstrate that 'highway equivalent' operating conditions are required for laboratory testing to avoid tire temperatures significantly hotter than those from 'the road.' We were able to explain that using these templates." (See figure 1 below.)

Not only do the models make this clear to engineers but, more important, to administrators and managers who aren't engineers or scientists. "We could present these models in real time on the screen to show them what was going on," says Spadone. "For example, they might ask, 'What if we ran a truck tire on the road-wheel at 80-percent inflation, 90-percent load, and 75 miles per hour? What would I have to do in the real world, on a flat surface, to equal that center-line temperature?' And the answer would be that you'd have to run at 90-percent load, 80-percent inflation, and 120 miles per hour to approach the same drive tire temperatures."
Such conditions would, of course, be extreme. Nobody expects a truck to go down the road at 120 miles an hour. Once the regression models were made, most of the work was in the templates, showing different what-if scenarios and translating road-wheel conditions into real-world conditions and vice versa.
"With three variables-- inflation, load, and speed--there are lots of possibilities," Spadone explains. "So you start setting limits--for example, we set limits on the inflation pressure at between 80 and 100 percent. Most of the work was done when we built templates using the prediction equations and looked at variations on the other conditions to see where we get equivalent temperatures 'flat-to-curved.'"
The benefit of having these clear, concise models is clear communication. "Sometimes there are different viewpoints on the data and on the nature of the problem," says Spadone. "So it's very useful to sit in a room with a computer and your templates and answer, on the fly, various questions and concerns. Sometimes we can't answer them, but we can go back and build more templates, and then come back with answers."
Spadone and the task group used the software's prediction-profiler function to change conditions and predict temperatures. "Once you have the model built, you can dynamically change conditions and find the answers. This is a really powerful tool for communicating the model. Many times, the answers people got were not the ones they expected. In some cases, they were quite taken aback," explains Spadone.
In this particular application, because statisticians and nonstatisticians alike had to be able to use and understand the software, it was important that the software be easy to use. "Several members of the task force had experience working with SAS, and when we started laying out the DOEs, they kept assuring those of us who are nonstatisticians that once we collected our data, it would be relatively easy to analyze--because we knew we were going to have tons of data, reams of it," says Ruip. "But they said, 'Don't worry about it; the modeling and the derivation of regression models will be fairly easy.' And they were right."
Certainly, translating otherwise puzzling data into laymen's terms is something Spadone appreciates. But as one who lives and breathes regression fits, what is most important is the ability to create complex models. "Essentially, I use models of models," he summarizes. "In other words, if we set certain parameters as constants, say a load or inflation, and then look at the relationship of speed on the road-wheel to the speed on the highway, I can build another regression fit, that is, a regression fit using predicted regression fits to show the relationship in a picture in the prediction profiler. So we've built a basic model, and then we go in and build models on top of that."
Spadone believes that because they were able to model these data and present them clearly, NHTSA has been appreciative and accepting of the task group's results.
"They have accepted the fact that there is a big temperature differential from flat to curved surfaces," he concludes. "Because of the power of these models and the power of the software to get answers quickly and display them in a way that's understandable to everyone, the task group feels it has contributed significantly toward the agency's task of developing new truck-tire regulatory tests.
"It's really helped us communicate the stuff that we already knew in our bones," says Spadone, "to present it as scientific fact, and to communicate it without argument."
Diana Levey is the marketing communications manager at SAS in Cary, North Carolina. Levey would like to thank Leighton Spadone for his valuable assistance in writing this article: Spadone is a technical project manager and chemist with 40 years of experience in research and development at Goodyear Tire & Rubber Co. He has a record of success in materials research, product and process development, design of experiments, statistical analysis, statistical process control, Six Sigma, and statistical model building.
|