| by Richard Batty
As the semiconductor industry matures, prices for products based on semiconductor components have dropped dramatically. Various quality initiatives such as Six Sigma have been implemented to increase quality and reliability, and to reduce cost. Decreases in price, and the likelihood that cost- reduction efforts have achieved most of the potential significant benefits, puts pressure on profits. One area that often receives attention is waste because any improvements in waste reduction will increase profits. However, to achieve this, it's critical to use an accurate metric for measuring profitability. As we shall show, use of the wrong metric will have a far-ranging effect on profitability with regard to waste reduction and many other areas.
Why do we say that manufacturers are using the wrong metric to measure profitability? Semiconductor companies, and most other complex manufacturers with a wide range of products, customers, and assets, traditionally use margin to gauge the profitability of products and customers. Margin is an accepted metric, and financial information systems have been tailored to measure it. However, using margin alone yields a flawed view of profit- ability because using margin only doesn't factor in the effect of production run rates on profitability. Consider the example in figure 1 below.
 Using margin only to rank products A and B clearly shows A to be the more profitable product. However, when margin is multiplied by production run rate to create a composite profit-per-minute metric rather than a profit-per-unit one, B emerges as the more profitable product, generating $1 million more in profit than A. Company shareholders are primarily interested in return on assets (ROA), which, although generally reported as a percentage, is in reality the profit achieved during the fiscal year. From the example above, it is readily apparent that focusing on maximizing margins or emphasizing high-margin products (or customers) will not maximize end-of-year profits and ROA. Using margin only to rank products A and B clearly shows A to be the more profitable product. However, when margin is multiplied by production run rate to create a composite profit-per-minute metric rather than a profit-per-unit one, B emerges as the more profitable product, generating $1 million more in profit than A. Company shareholders are primarily interested in return on assets (ROA), which, although generally reported as a percentage, is in reality the profit achieved during the fiscal year. From the example above, it is readily apparent that focusing on maximizing margins or emphasizing high-margin products (or customers) will not maximize end-of-year profits and ROA.
Semiconductor manufacturers are constantly making decisions to answer four key questions: What products should we make? Who should we sell them to? Where should we produce them? How much should we charge?
The decisions made in answering these questions directly affect the profitability of the company. As seen in figure 1, a decision to make more of one product than of another (possibly due to one product having greater waste in its production) could lead to lower profits if margin-only is used as the profitability metric. The same situation occurs if customers are ranked on margin rather than on profit per minute. The profitability of products by production facility looks quite different depending on the profitability metric used. As we shall see, decisions are radically different when a profit-per-time metric is used rather than a margin-only one.
Let's look at a practical example. Figure 2, below, shows several products sold into the wireless market. The five products are ranked by cash contribution per minute (analogous to profit per minute).
 Notice that ranking by this metric also ranks the products by ROA. So, in effect, cash per minute is the operational equivalent of ROA. It is important to emphasize using cash per minute because a profitability metric makes it possible for the first time to use ROA at the operational level. For the first time, there is a match between the key operational metric and the one of most interest to shareholders, ROA. Notice that ranking by this metric also ranks the products by ROA. So, in effect, cash per minute is the operational equivalent of ROA. It is important to emphasize using cash per minute because a profitability metric makes it possible for the first time to use ROA at the operational level. For the first time, there is a match between the key operational metric and the one of most interest to shareholders, ROA.
The second major point to emphasize from this table is that there is no correlation between margin and cash per minute. The product ranked fourth by cash per minute actually has the highest margin. But its cash per minute and ROA are substantially lower than the three products ranked above it.
Consider the implications of using margin to make decisions on product mix. The sales team focuses its efforts on selling the higher-margin products. The marketing group focuses its programs on increasing demand for these products. Production prioritizes these products for manufacturing. Finance makes capital- investment decisions favoring facilities and production lines where the higher-margin products are made. The decisions made by all four departments are drastically different if profit per minute is used as the profitability metric. As we showed with the simple example above, margin-based decisions will not optimize profits. Only by using a profit-per-time metric will this be possible.
The conclusions drawn from the data shown in figure 2 are even more dramatic when presented in figure 3.

Plotting cash per unit vs. units per minute generates topographical contour lines that represent equal amounts of cash per minute. Just like the elevation contours of a geographical contour map, the contours of this "profit topo" map increase in both cash per minute and ROA by moving to the upper right of the chart. It is easily seen that the product represented by the green bubble on the right-hand side of the chart is the most profitable from a profit-per-minute perspective. Similarly, it is apparent that the product represented by the yellow bubble on the upper left, while having the highest margin, is actually below the average cash per minute indicated by the blue contour line.
Many companies realize the importance of incorporating production run rate with margin for evaluating profitability. This challenge becomes extremely difficult to solve when manufacturers have hundreds or thousands of products and customers, and multiple production facilities. Beyond being able just to combine margin and production velocity, the profit topo map enables individual products, customers, markets, sales regions, or production facilities to be displayed in this format. This makes it much easier to identify the high and low performers.
Measuring profitability at a granular level based on a profit-per-minute metric is obviously attractive; even better, it can be used to improve profits. The key is to model changes in product quantities, prices, costs, and production run rates to see the effect of those changes on profitability when measured on a profit-per-minute basis.
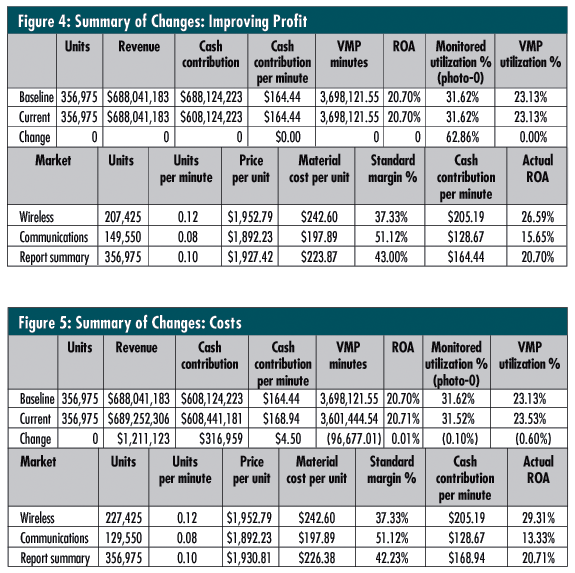
 Figure 4 shows data for products sold by a semiconductor manufacturer into two different markets. The products sold to the communications market generate a higher margin than those sold into wireless--51 percent vs. 37 percent. However, based on cash per minute or ROA, the wireless products are more profitable for the company--$205 per minute vs. $128 per minute. Figure 4 shows data for products sold by a semiconductor manufacturer into two different markets. The products sold to the communications market generate a higher margin than those sold into wireless--51 percent vs. 37 percent. However, based on cash per minute or ROA, the wireless products are more profitable for the company--$205 per minute vs. $128 per minute.
The manufacturer felt that it could sell more into the wireless market than it had been doing. It had not focused its sales team or marketing efforts on wireless due to the lower margins that this market produced. However, for the upcoming quarter, the company felt it could sell 20,000 more units into wireless. Because the plant was operating close to capacity, this meant cutting 20,000 units for the communications market. Figure 5 shows the effect this proposed change in product mix would have on profitability.
As the table shows, the switch in quantities for products for the two markets, although keeping the total quantity the same, was an increase in cash of almost $317,000. The production team implemented this change in its operating plan and achieved the anticipated increase in cash. The switch in product quantities also opened up more than 96,000 extra production minutes, many of which were used to fill orders for demand in other markets.
Semiconductor companies are starting to use a profit-per-minute metric in many of their everyday processes. For example, one semiconductor manufacturer is assessing the profitability of its customers using profit per minute rather than the previous margin-only approach, and revising service levels based on the new profitability ranking. Others are using the profit-per-minute metric to rationalize products from their product lines, to model new products, to load production lines, and to look at alternative routings for products.
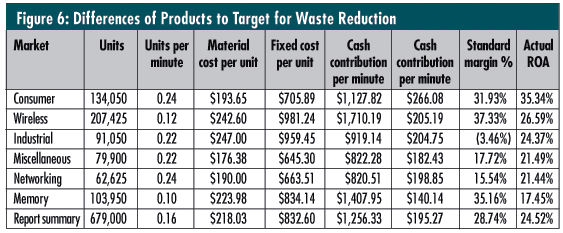
Let's look specifically at how a detailed profit-per-minute approach is helpful in reducing waste. When looking at where to reduce waste, a manufacturer might typically look at which products yield the lowest margins and target those alone. This seems completely reasonable because the company will likely have limited resources and must focus its efforts where it anticipates that it will have the most effect. However, as we have seen, the lowest-margin products are not necessarily those that generate the lowest cash per minute or ROA. Because we now understand that it is cash per minute and ROA that we want to maximize to optimize profits, we are likely to target a different set of products for waste reduction than if we were using a margin-only approach. Consider the table in figure 6, below.

Based on a margin-only approach, the manufacturer would target the products sold into the industrial market for waste-reduction efforts. However, when viewed from a cash-per-minute or ROA perspective, the industrial products are actually the third-most profitable market for the company. It is the memory market products, despite having the second-highest product group margin (35%), that yield the lowest cash per minute and ROA.
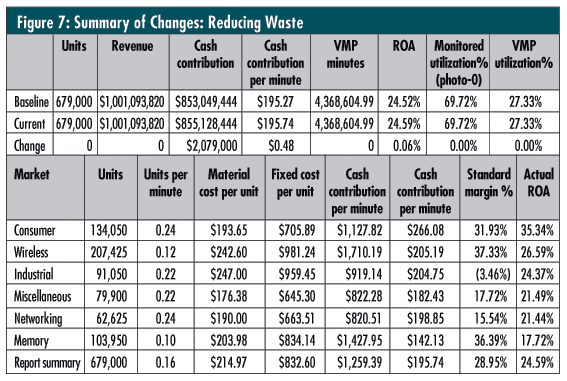
If the manufacturer's limited resources are directed to the memory market products, let's assume that this effort can reduce waste of material and thereby cut material cost by $20, from $223.98 per unit to $203.98 per unit. The net result is that cash is increased by more than $2 million, as shown in figure 7.

To be able to make this kind of targeted effort, certain things are required. First of all, the key data must all be brought into a central location, something that not all manufacturers have in place. Second, it is critical to view the data at a detailed level. The more detailed it is, the more targeted any productivity initiatives can be. Third, it must be possible to view the data from a profit-per-minute perspective, not just from a margin-only one. Certainly, any initiative that reduces waste will improve profits, and so using a margin-only approach to profitability will help cut waste and improve profits. But because waste reduction, along with any other productivity effort, is about maximizing profits, only by using a profit-per-minute approach will waste-reduction efforts maximize profitability and ROA.
Switching from a margin-only to profit-per-minute measure of profitability provides semiconductor and other complex manufacturers with a whole new means to improve profitability. Use of the right metric allows all key operating decisions and productivity efforts, including waste reduction, to truly maximize profits. Using profit per minute instead of margin frequently results in profit increases of up to 5 percent of revenue, which equates to $50 million per year for a company with $1 billion in revenue.
Richard Batty is director of product marketing at Maxager Technology Inc. ( www.maxager.com ) He is a 22-year veteran of the information technology industry with experience in marketing, product management, and operations. His background includes prior experience at Hewlett-Packard and an initial public offering startup.
|