Les Ismore is a downsized-accountant-turned-statistician. He lost his job at Greer Grate & Gate because
Quality Manager Hartford Simsack didn't want his own statistical knowledge questioned. Besides that, Ismore was driving Simsack crazy with his incessant mumbling under his breath. Simsack--plenty
insecure already about his competence for his position--believed Ismore was making snide comments about his statistical prowess, and that simply wouldn't do. Despite of the fact that
Ismore has never understood much about statistical process control, he believes that because he's a "numbers person," he may as well call himself a statistician. The pay may not be
better, but he loves the title, which sounds so much more distinguished than "accountant." Additionally, he figures, if he can fool Simsack, he can fool his way into a position as a
government statistician. Ismore proves himself correct. Hired as a temporary employee by a government health and demographics agency, he's charged with the task of statistically
assessing health risks based on age and geographic data. He has so much data at his disposal that he feels confident that his study cannot fail. He needs only to decide on a particular malady and
create a frequency distribution to show how often that problem recurs at various age groups. "This will be a piece of cake," he mumbles to himself as he installs yet another computer
game on his laptop. The health problem to which Ismore has the most accessible data source is lower-back pain from a variety of causes (including injury). Because almost
everyone has had an experience with back pain at some point, Ismore believes that using this symptom will give the data broader appeal. And because he experiences the symptom himself, he's
confident that he can relate to the data directly.
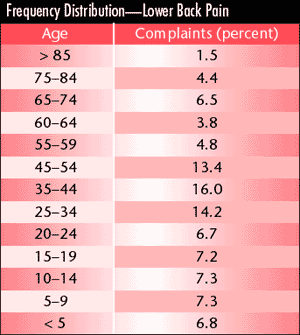
Ismore creates a frequency distribution from the data he has available. "Wow," he says. "This is alarming data." From his chart, he concludes
that the age groups that fall between 25 and 54 have up to twice as many incidents of back pain than other groups. "Who would think people that young would have so many
problems?" he wonders as he ponders the possibility of publishing his findings: Instant fame. Book signing parties. Cash. He feels smug in his knowledge that Simsack would never get such an
opportunity back at old Greer Grate & Gate. What common error--the same error made in the May 15, 2001, issue of USA Today in an article on
population growth--has Ismore made in constructing the frequency distribution for his data?
Conclusions based on this frequency distribution will be flawed because Ismore hasn't bothered to determine appropriate intervals for his data; indeed he has created
two different intervals, one of five years (i.e., 20-24) and one of 10 years (i.e., 35-44). The number of low back pain incidents in the 10-year interval group would
of course be larger than if it had been distributed into five-year groups. Setting up frequency distributions and histograms so that the data can be analyzed
accurately involves several steps that must be taken. First, determine the appropriate number of class intervals. Most statistics texts,
such as Practical Tools for Problem Solving (PQ Systems Inc.), provide guidance. Generally, the recommendations are:
Number of Data Points |
Number of Classes |
<50 |
5-7 |
50-100 |
6-10 |
101-250 |
7-12 |
>250 |
10-20 |
|
Next, determine the class interval by finding the range of the data. Range = Xhighest - Xlowest and then dividing by the number of intervals desired. class width = range of data set/number of classes This provides a class-width estimate that is often rounded for ease of interpretation,
using units such as 5 or 10. All class intervals are the same except for the first and last, which may be open ended (e.g., greater than 85 or less than 5).
Finally, complete a tally sheet for the data. Ismore's error related to his selection of class intervals. Groups with larger intervals
will naturally contain more data simply because they are larger. Any other conclusions are fallacious.
About the author Michael J. Cleary, Ph.D., is founder and president of PQ Systems Inc. He has
published articles on quality management and statistical process control in various journals. E-mail Cleary at mcleary@qualitydigest.com. |