| by Derrell S. James
Six Sigma. Lean. What do these
initiatives have to do with the supply chain? The short
answer is everything. The origins of these approaches are
based, in Six Sigma’s case, on continuous improvements
in quality and variation control, and in lean’s case,
on production velocity and eliminating waste. Both Six Sigma
and lean can help improve supply chain efficiency, and companies
today are quick to take advantage of one or the other approach
throughout their organizations. However, few companies realize
that while each approach can be mutually exclusive, an interesting
thing happens when the two are combined.
Which brings us to our first question.
In the “old” days, quality advocates functioned
more or less as company cops, authoritative figures who’d
get you in trouble for taking shortcuts. Today, and definitely
in the future, the quality professional’s role will
have less to do with blowing the whistle than seamlessly
integrating processes within all business operations relating
to customers. This represents a distinct departure from
the past and requires specific tools and procedures. To
access these tools, companies are combining lean and Six
Sigma methodologies. Thus, to answer the question, quality
professionals haven’t forgotten what customers want,
but the quality community has never fully realized the best
approach for recognizing customers: defining value, delivering
it and maintaining accountability for those goals.
Which leads us to the next question.
First, what is value? Simply, it’s whatever the
customer says it is and is willing to pay a company to deliver--whether
goods or services. Lean says in order to measure value inhibitors,
increase value and eliminate waste, we must construct a
value stream map of our current state, create another map
for the future that includes the same processes without
the waste, and then devise an action plan to take us to
that future state and beyond to the ideal state: perfection.
Six Sigma tells us to measure these processes and establish
variation-reducing controls to ensure a consistent output.
That methodology also tells us to ensure conformity. Taken
separately, the lean and Six Sigma approaches could possibly
be viewed as conflicting. These days, companies are learning
that, in fact, the two methodologies are complementary,
if not inseparable.

Within the supply chain, quality professionals must ensure
adherence to processes, compliance to requirements based
on the customer’s definition of value, elimination
of nonvalue-adding activities, and documentation for consistency
of purpose and practice. To do this, we must position ourselves
as authorities on value--and what maximizes value for our
companies.
This brings us to our third question.
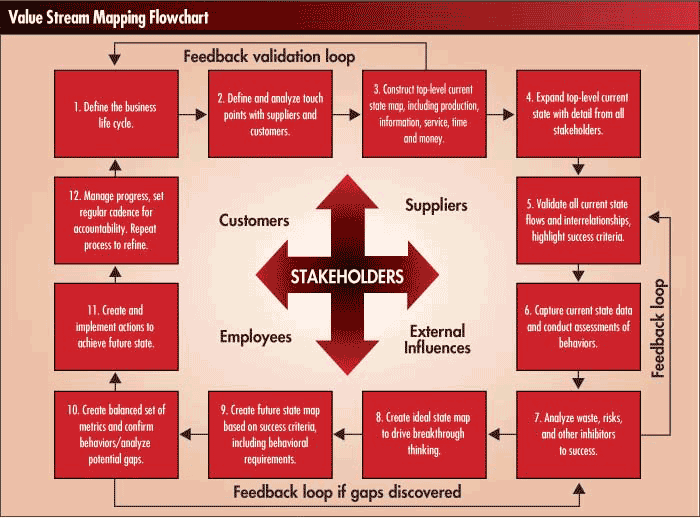
Absolutely. The value stream mapping flowchart on page
35 illustrates a methodology that will lead to a clear map
of processes feeding into and through a company before being
realized by the customer--i.e., the total supply chain.
Each of the 12 steps follows the lean value-stream mapping
methods from James P. Womack and Daniel T. Jones’
invaluable Lean Thinking (Free Press, 2003). These steps
involve every function at every level of a company, whether
large or small, manufacturing or service. Additionally,
when companies recognize that variation is undesirable in
the quality world, they can incorporate Six Sigma variation-reduction
methods to strengthen the streamlined processes and devise
the balanced metrics needed to measure success.
The 12 steps for conducting total supply chain value-stream
mapping and analysis are as follows:
To define your company’s business life cycle, start
by answering the following questions:
 What is the company’s vision and mission?
 What are the company’s major processes or organizational
flows?
 What are the boundaries?
 Who are the key value stakeholders?
 How do key value stakeholders--i.e., the company, its suppliers
and its customers--define value for the identified business
life cycle?
 What are the outcomes expected from the business and relationships
with suppliers and customers?
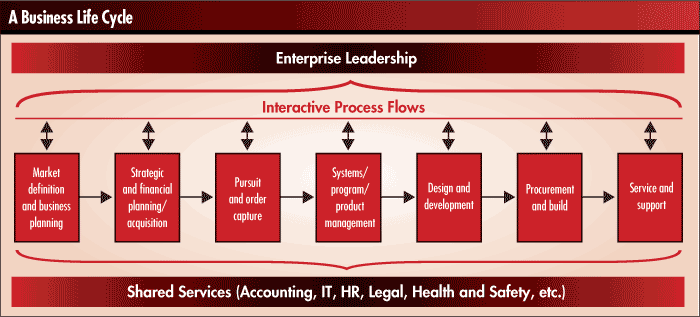
For example, a generic business life cycle for a company
might look like the figure below.

Customers’ and suppliers’ interactions occur
at points all along the life cycle and thus are inseparable
from the company processes noted in step one. If your analysis
uncovers communication breakdowns that reduce value, add
waste or reduce the passion for success, these should be
clearly identified for intense analysis and scrutiny during
subsequent steps.
A representation of these total supply chain interactions
is required, including the interactions of leadership; any
touch points between suppliers, customers and the company;
and how these processes are integrated. Make a note of the
“softer” side of the relationship by expanding
upon the following:
 Describe the relationship between each company department
and its supplier or customer--is it cordial, collaborative,
adversarial, nonexistent?
 Describe the personalities of the people involved in the
relationships. Are they proactive or reactive, responsive
or procrastinating, talkers or listeners? Consider ways
in which the relationships can be improved.
At this point, it’s a good idea to evaluate how
thorough you want the value stream map to be. Too much analysis
will provide inordinate and unmanageable data but too little
will hinder you from identifying wasted resources or process
steps.
Assess other potential flows or shared services that might
not be enterprisewide but run parallel to those already
depicted. Enabling infrastructures such as information technology,
e-business, human resources, accounting, and social/cultural
customs should be included. Finally, analyze external influences--societal,
environmental, political--that might affect the map, as
well as any destabilizing forces. These might include policies,
laws, demographics or other trends.
Assess and map the flow of products, programs, services,
information, money and time based on the business life cycle
defined in step one.
The resulting map and lists of influences represent the
current state--or level one work breakdown--of the enterprise.
At this point, validate boundaries, values, company outcomes,
vision and mission as identified in step one. Adjust these
as necessary to reflect current business realities.
Take each portion of the current state and drill down
a minimum of one layer to the details of constituent processes,
flows, components or influences. Assess the processes and
document interfaces as well as the “softer”
sides discussed in step two. This drilling down allows you
to clearly see the interaction of the various flows, both
technical and social, and to gather more specific data for
analysis.
Overlay all informational, social and technical components
of the flow not already captured and mapped. Validate the
connections, interrelationships and decision points of the
work breakdown in its current state. Add any shared service
or enabling infrastructures such as IT, human resources
and leadership to the map. Ensure that the information gathered
reflects your current business reality. Challenge any details
that are merely assumptions, exaggerations or oversimplifications.
Capture relevant data that’s measured in terms defined
by the company, suppliers and customers, and ensure definitions
are consistently understood to prevent data comparison flaws.
You want to capture the metrics or information available
for each process piece and analyze/link the behaviors that
each generates. Conduct assessments, interviews or nonadvocate
reviews to capture other data elements and create a comprehensive
view of the total supply chain.
Analyze and identify wastes, inhibitors of flow and value,
costs, risks to flow and risks to success criteria. Group
these findings into enterprise themes and then analyze how
each affects time, resources and money. It’s important
to re-analyze step five to ensure that nothing was missed.
You may be thinking many of the tasks in steps two through
seven are redundant. They are, and that’s intentional.
Without a true and complete representation of a company’s
current state, any hope of achieving an effective future
state is moot.
Create an ideal state based on a joint definition (i.e.,
by supplier, customer and company) of perfection. Include
technical and social elements of this state such as work
and information on demand; one-by-one processes or single-piece
flow; defect-free work in administrative, production or
service processes; lowest possible cost; committed and capable
workforce; autonomous decision-making; rewards linked to
performance; goal alignment and communications. Obviously,
achieving perfection is impossible, but setting it as a
goal encourages breakthrough thinking and analysis that
will create a more robust future state. It also allows quality
professionals to more fully integrate into the enterprise,
thus eliminating any lingering “quality cop”
images.
Map out a future state you can reach in a relatively short
time--e.g., 12 months--based upon the ideal consensus. Consideration
must be taken of the behaviors required for success as well
as success criteria determined by the customer, company
and suppliers.
Assess and analyze the gaps in the company’s ability
to achieve the future state. Create a balanced set of measurements
for success, and confirm that the behaviors generated conform
to future-state directives. A balanced scorecard approach
allows those involved to create measures that complement
each other. They can also use lean and Six Sigma to evaluate
processes.
For example, service turnaround time is a typical lean
metric. An additional and balancing Six Sigma metric would
be to measure the percentage of service provided within
x number of days. This ensures the team meets requirements
for average turnaround time and minimizes variation around
that average. Execution of that particular process in the
future state then becomes a given. What is quality if not
the clear and successful execution of agreed-upon requirements
between suppliers, customers and the company?
Additionally, validate any gaps found and return to step
seven in order to capture, measure and complete the mapping.
Establish and implement actions, programs and events to
help create value and eliminate waste, thereby achieving
the future state. Create necessary infrastructure to ensure
leadership, integration, course corrections, validation
and accountability for the changes. Analyze risks, change-management
issues and other inhibitors to successful implementation.
Ensure actions allow for a total supply chain view that
will create a win-win situation for all stakeholders.
Establish a renewal period--say, a rolling 12-month view--to
revisit and adjust the future state as it moves toward the
ideal. Build into this process stakeholder enrollment, ownership
and accountability for all actions and ongoing analyses.
Many quality professionals consider this step critical.
Each opportunity to discuss, raise issues, analyze and renew
activities with the total supply chain allows stakeholders
to integrate the social changes needed for success.
Which brings us to our last question.
 To
ensure lasting support and buy-in from all stakeholders,
companies must integrate the social and technical aspects
of change management that occur in a joint lean/Six Sigma
transformation. Each stakeholder noted in the 12-step process
has a personal stake in the company’s future success
and will naturally form emotional attachments to the process
in anticipation of the expected outcome. To
ensure lasting support and buy-in from all stakeholders,
companies must integrate the social and technical aspects
of change management that occur in a joint lean/Six Sigma
transformation. Each stakeholder noted in the 12-step process
has a personal stake in the company’s future success
and will naturally form emotional attachments to the process
in anticipation of the expected outcome.
By integrating lean and Six Sigma approaches throughout
the total supply chain, companies can manage change more
effectively, engage customers and vendors, and ensure success.
Quality professionals must recognize and embrace this concept.
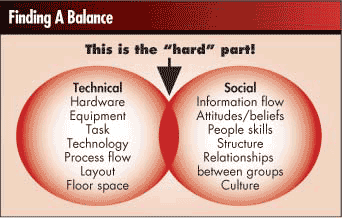
It’s been said many times that the “soft stuff
is the hard stuff.” That’s not really true.
It’s the interaction of the social aspects of business--typically
called the “soft stuff”--with the technical
aspects that truly becomes the hard stuff.
The overlapping area in the above diagram denotes where
a quality professional can add the greatest value. Leaders
must loosen up and realize that success doesn’t happen
simply by complying rigidly to a standard. True success
comes from delivering value. Great quality systems and leaders
in the future will emerge from applying lean and Six Sigma
throughout the supply chain. The two approaches will force
an internal and external focus well beyond the technical
parts of a business.
Quality isn’t a department, and the supply chain
isn’t a buzzword for aligning organizational structures,
creating centers of excellence or facilitating more silos
for servicing customers. If we extend W. Edwards Deming’s
fundamental point of eliminating “walls” between
organizations to include suppliers and customers as intimate
and integral parts of our processes, we’ll truly realize
our quality potential.
Derrell S. James is the general manager of Sypris
Test and Measurement’s calibration division. He has
15 years of experience in operations leadership and business
development in high-technology manufacturing and service
industries. James is a frequent speaker and writer on leadership,
lean and continuous improvement, and operational effectiveness.
Sypris Test and Measurement is a leading provider
of calibration services, test and measurement services,
and specialty products to major corporations and government
agencies. Sypris’ nationwide network of state-of-the-art
fixed and mobile calibration laboratories are certified
by A2LA for ISO/IEC 17025 and are also ISO 9001-registered.
Visit www.calibration.com
or www.sypris.com
for more information.
|