Image courtesy of Limble
Body
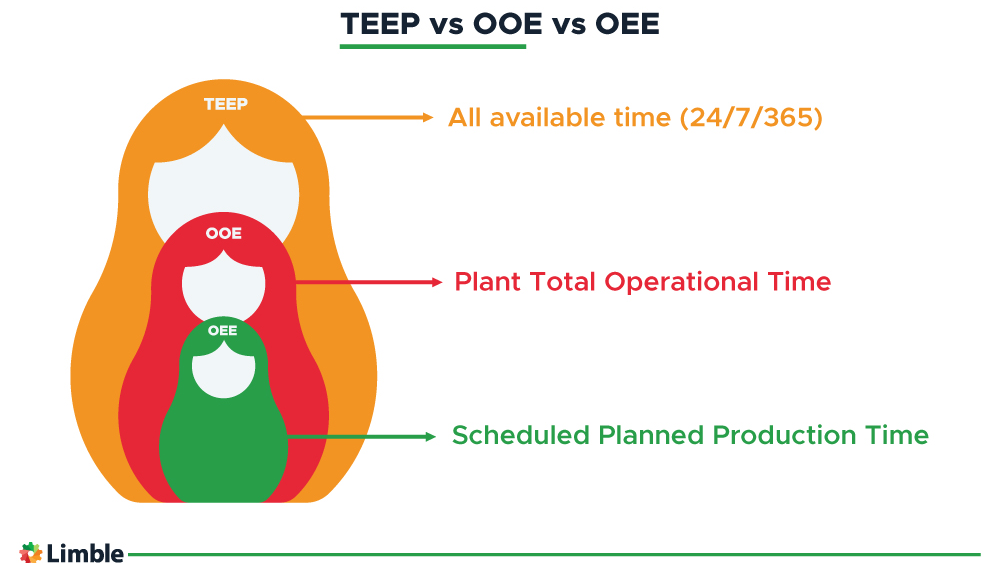
In manufacturing industries, calculating overall equipment effectiveness (OEE) offers deep insights into the performance of production processes and enables data-driven improvements.
|
ADVERTISEMENT |
Determining OEE is a standard method for assessing the productivity of production lines compared to their potential. Organizations in manufacturing sectors, including pharmaceuticals, food and beverage, and utilities, use OEE data to eliminate inefficiencies and drive continuous improvement.
…
Want to continue?
Log in or create a FREE account.
By logging in you agree to receive communication from Quality Digest.
Privacy Policy.
Comments
Gobledegook
Tracking performance, availability, and quality scores each on their own process behaviour charts may help you to improve your processes. Each of these metrics may reveal signals of degradation or improvement, the investigation of which can impart the process knowledge necessary to operate processes more consistently.
Multiplying these three figures together doesn't make any sense, though, and treating the product of the three as something important can only lead to numerical jabberwocky. In context, the data streams of the performance, availability, and quality scores will add up to a story about the things that you care about as a manufacturer; multiplying the figures together is a conscious choice to care less about this story and care more about abstracting meaningful data into a meaningless numerical value.
OEE - Utter Nonsense
As Dangermoney correctly points out, OEE is an utter farce.
Dr Wheeler explains it so succinctly: "OEE is like using our weight times our height times our systolic blood pressure, as a measure of how good looking we are."
If it could be any worse, OEE uses the antiquated 1870 definition of quality.
New article on OEE
Per Dr. Wheeler's new article on OEE:
"So, while you may use the metrics for availability, quality, and performance separately, you should resist the temptation to combine them. For when they are combined into OEE, they create a value that can only be described as numerical jabberwocky."
Add new comment