
Statistics

Most data in business and industry belong to the category known as observational data. These data are the voice of your processes because they are the result of ordinary operations rather than an experiment.
Because the purpose of analysis is insight, the question is how to…

Performance indexes use the global standard deviation statistic to describe the past. Capability indexes use a within-subgroup measure of dispersion to characterize the process potential. However, some within-subgroup measures are better than others. This article will explain why you should not…

One of the principles for understanding data is that while some data contain signals, all data contain noise. Therefore, before you can detect the signals you’ll have to filter out the noise. This act of filtration is the essence of all data analysis techniques. It’s the foundation for our use…

When administrative and managerial data are placed on an XmR chart, the first reaction will frequently be that the limits are far too wide: “We have to react before we get to that limit.”
So what are we to do when this happens? Are the limits really too wide? There are three cases…

Everybody wants to have good measurements. To this end, many recommend a regular schedule of recalibration. While this sounds reasonable, it can actually degrade the quality of the measurements.
The key to getting the most out of a measurement process is to know when to…
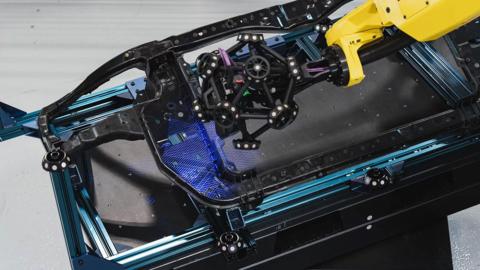
C hallenges abound for today’s manufacturers. Labor shortages and rising labor costs require innovative solutions to maintain productivity with fewer staff. Inflation continues to exert pressure on raw material costs, squeezing margins. Manufacturers are also racing against tight production…