
The peacock’s plumage serves as an example of “Fisherian runaway,” a concept of natural selection named for Sir Ronald Fisher, who also created the analysis of variance (ANOVA). Credit: Creative Commons; photo by Haribabu Pasupathy.
Social Sharing block
When Sir Ronald Fisher created the analysis of variance (ANOVA) in the 1920s, he extended the two-sample t-test to allow the comparison of k sample averages. During the same time period, Dr. Walter Shewhart was creating the process behavior chart. So it should be no surprise that both techniques are built on the same mathematical foundation, even though they appear to be completely different at first glance. This column looks at the differences in what’s required to use each technique to improve a process.
|
ADVERTISEMENT |
A new product was being made on an existing production line that had no temperature control system for the bath. When the initial production run had 25% nonconforming product, the project team decided to see if they could improve things by controlling the bath temperature.
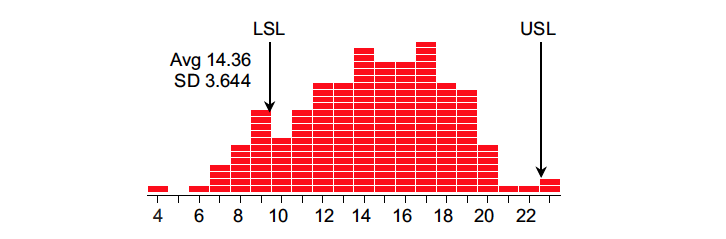
Figure 1: Process outcomes during experiment
…
Comments
ANOVA vs Process Behavior Charts
Dr. Wheeler proffers the most lucid contrasts to be had. Bravo!
ANOVA vs PROCESS CONTROL CHARTS
"Incidentally, that makes them [Process Behavior Charts] much easier to use in a production environment than experiments [ANOVA]."
Having worked in manufacturing for 40 years, I have had many discussions of the value of experiments vs process control analysis. People trained in doing laboratory experiments often proposed work based on a conviction they knew what needed to be changed to improve a process. If that didn't help, they would propose a different experiment. Sometimes Evolutionary Operation making changes believed small enough to not produce non-conforming product, coupled with process control analysis helped our learning. Other times just initiating and continuing process control charts were best.
Thank you for this comparison.
Adding to my list of Wheeler wisdom
Whenever reading Dr. Wheeler's work, I always walk away with a nugget I am sure to share with others. This article did not disappoint, "While ANOVA treats background noise as an obstacle to discovery, process behavior charts consider the background noise as an opportunity for discovery."
Add new comment