
Mon, 01/08/2018 - 12:03
The precision to tolerance ratio is commonly used to characterize the usefulness of a measurement system. While this ratio is appealingly simple, it overstates the damage due to measurement error. In this paper we show how to compute honest…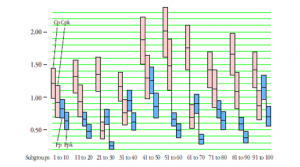
Mon, 12/04/2017 - 12:03
Capability ratios are widely used and sometimes misunderstood. The computer will gladly offer up values of each of the commonly used capability and performance indexes. Yet there is little appreciation of the inherent uncertainty contained in each…
Mon, 11/06/2017 - 12:03
In theory, a production process is always predictable. In practice, however, predictable operation is an achievement that has to be sustained, which is easier said than done. Predictable operation means that the process is doing the best that it…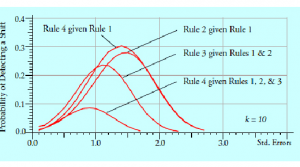
Mon, 10/09/2017 - 12:03
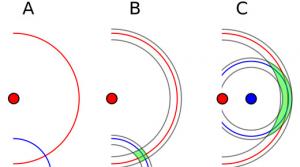
How do extra detection rules work to increase the sensitivity of a process behavior chart? What types of signals do they detect? Which detection rules should be used, and when should they be used in practice? For the answers read on.
In 1931, …
Tue, 09/05/2017 - 12:03
Sometimes we use a chart for individual values and a moving range (an XmR chart) to assess the homogeneity of a finite data set. Since this is an "off-label" use for the XmR chart, we first consider the drawbacks associated with using a sequential…
Mon, 08/07/2017 - 12:03
Last month I mentioned that we can put autocorrelated data on a process behavior chart. But what is autocorrelated data and what does it tell us about our processes? This article will use examples to answer both of these questions.
Autocorrelation…
Mon, 07/10/2017 - 12:03
The simplest type of process behavior chart is the chart for individual values and a moving range. It allows us to plot a point every time we get a value, making it perfect for data that occur one value at a time. A brief history of this simple…
Mon, 06/05/2017 - 12:03
In their recent article, “We Do Need Good Measurements,” Professors Stefan H. Steiner and R. Jock MacKay take exception to two of my Quality Digest articles, “Don’t We Need Good Measurements?” and “The Intraclass Correlation Coefficient.” While we…
Mon, 05/01/2017 - 12:03
Here we take a serious look at some nonsensical ideas about capability ratios. Following a quick review of predictability and capability and a brief discussion of the traditional ways of characterizing capability and performance, we will consider…
Mon, 04/03/2017 - 12:03
A recent question from a statistician in Germany led me to the realization that the F-test of analysis of variance (ANOVA) fame is in serious need of an update.
What the F-ratio does
The F-ratio, created by Sir Ronald Fisher around 1925, is a…